Cleanroom background image - mid

WHAT DOES ONE DAY OF CLEANROOM DOWNTIME COST YOU?

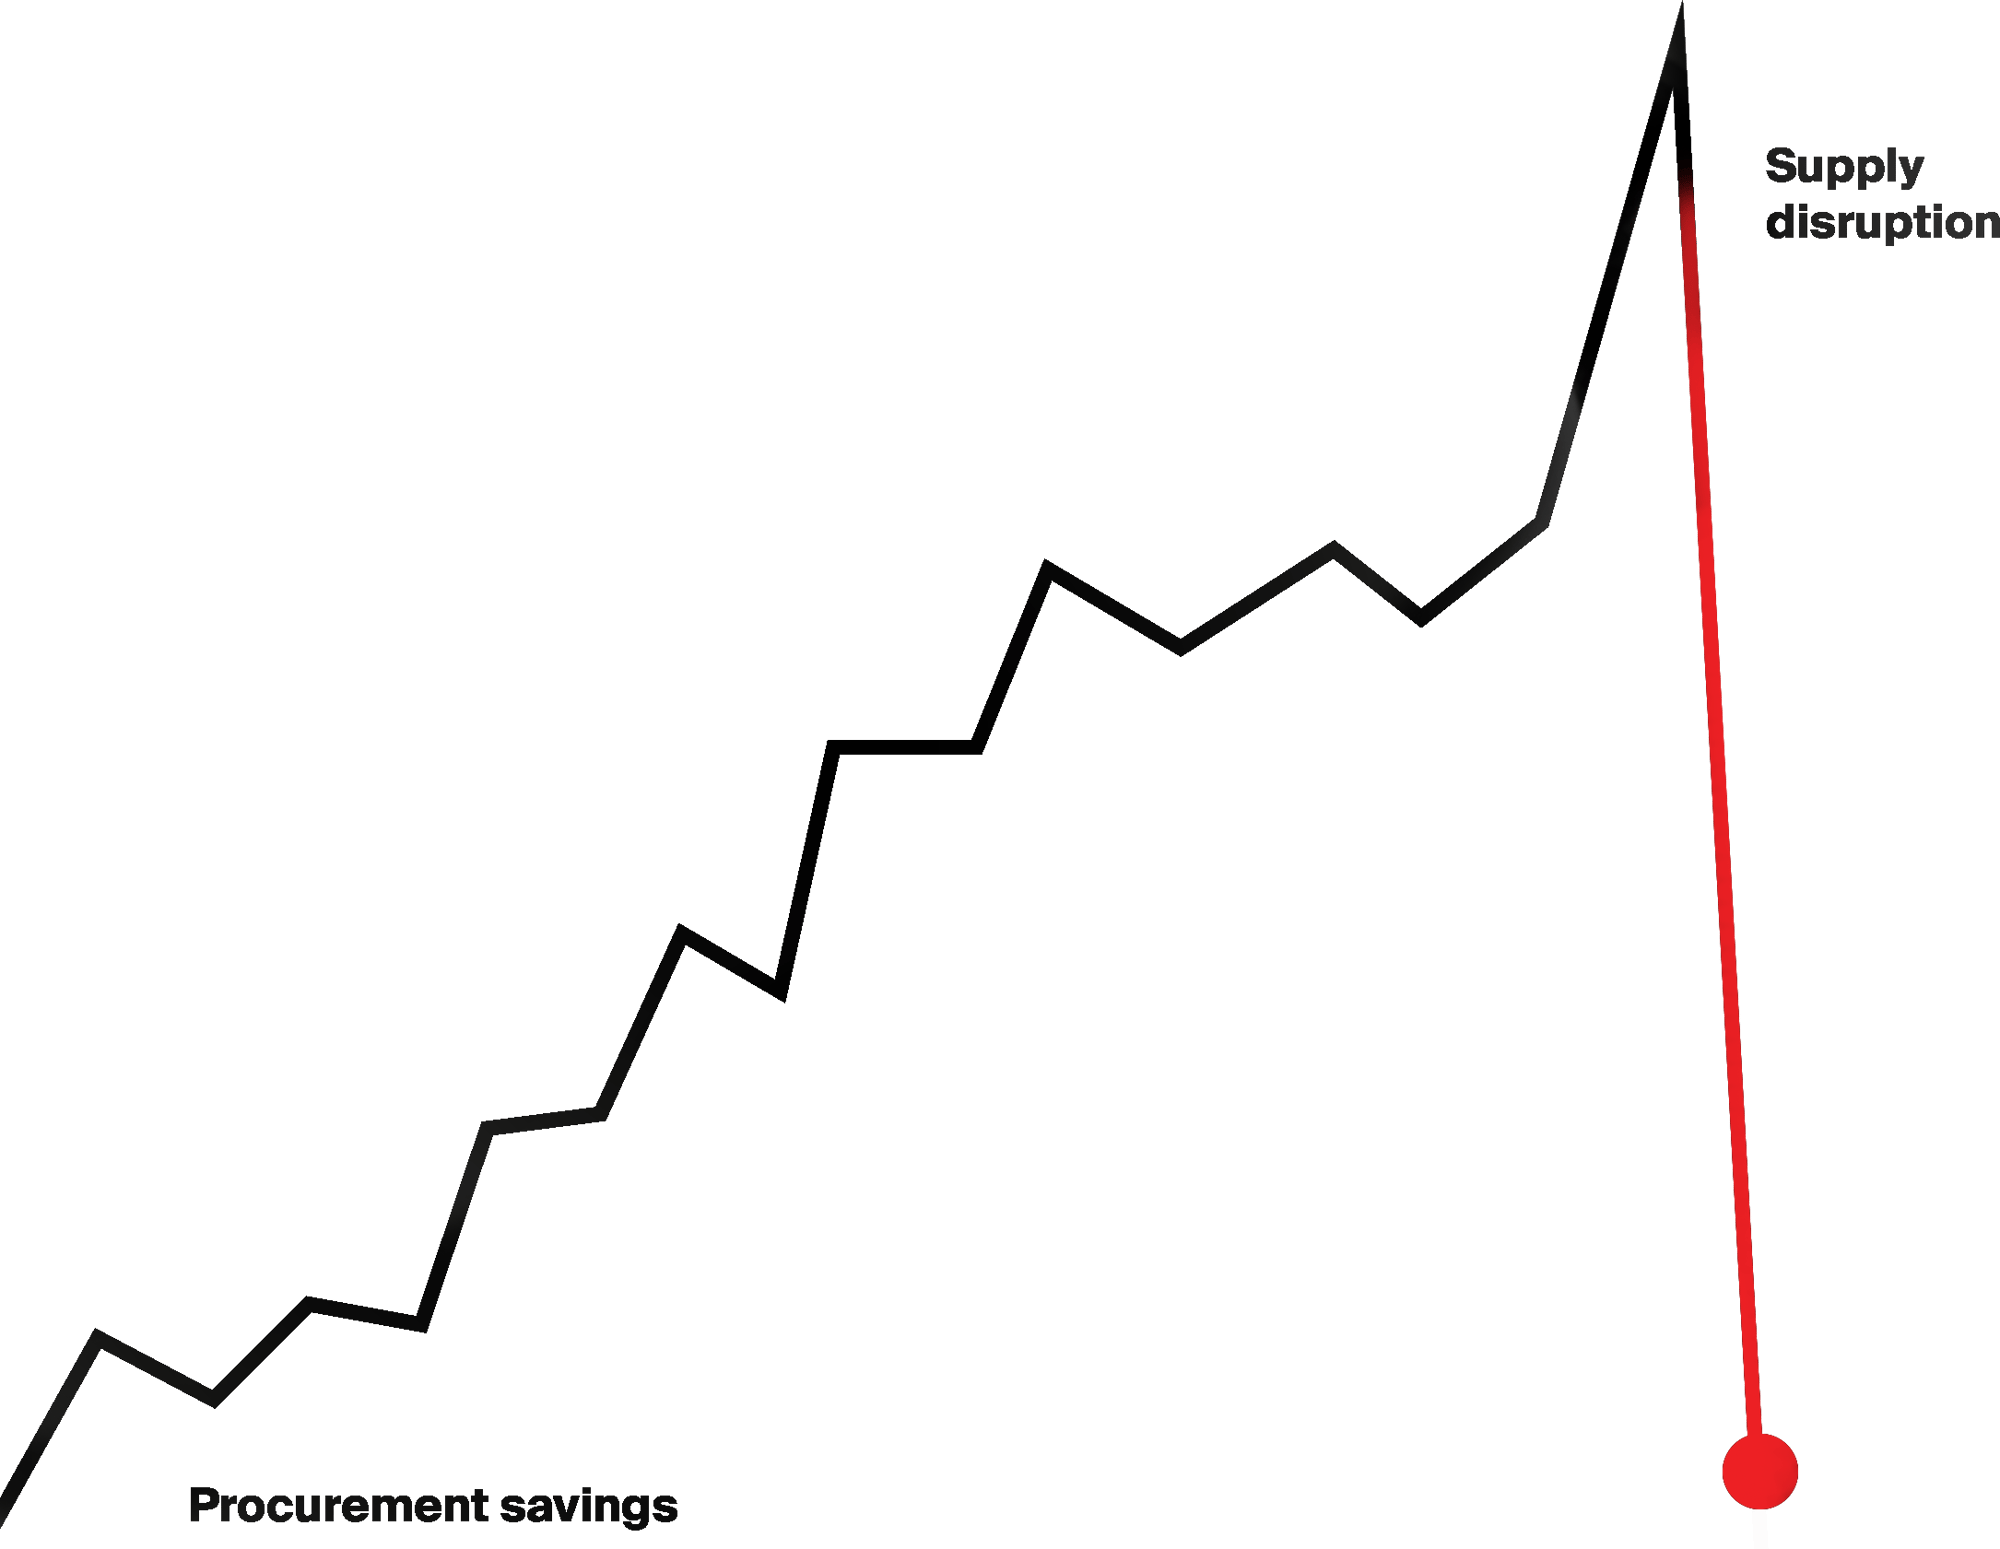
A single disruption can erase years of procurement savings.
Identify operational vulnerabilities before they impact production. 
Graph_LP

Incremental Savings. One Big Disruption.

Procurement cost reductions often look good on paper.
But they can introduce hidden operational vulnerabilities:  

•  Unvalidated suppliers

•  Reduced buffer stock

•  Limited processing redundancy 

When disruption hits, the financial impact isn’t €10,000.

It can reach €68,000–€228,000 per day, easily wiping out years of negotiated savings.

To help operations and procurement teams identify vulnerabilities before they escalate, we developed a practical framework for evaluating cleanroom continuity.

The Cleanroom Continuity Guide introduces the five operational risk areas that most commonly lead to disruption, and how to address them.

Evaluate Your Cleanroom Continuity Risk in Three Simple Steps

 Operational disruptions rarely happen without warning.
Use this structured evaluation path to identify vulnerabilities, measure their impact, and strengthen your cleanroom’s operational resilience. 

Map your continuity risk

Watch our on-demand session with Ciaràn Houlihan, where we’ll show you how to systematically identify, assess, and prioritize continuity risks across your cleanroom operations, before they impact production.

What you'll learn:

✔ Why cleanroom disruptions are increasing and where teams underestimate risk
✔ The 5 operational risk areas that most often lead to downtime
✔ How disruptions actually unfold based on real-world scenarios
✔ A practical approach to assessing your own continuity risk exposure
✔ The key warning signs and questions that help prevent downtime early

STEP 1

Where Is Your Cleanroom Exposed? 

Most cleanroom operations carry hidden vulnerabilities across five continuity pillars. 

Supplier instability

supplier instability
 Suppliers that are not properly validated, audited, and regularly reviewed can introduce hidden operational risk. 

Stock availability gaps

box_1000dp_73E0C1_FILL0_wght400_GRAD-25_opsz48
 Buffer stock that’s too small or poorly aligned with lead times can quickly lead to shortages during disruptions.

Certification access failures

verified_user_1000dp_73E0C1_FILL0_wght400_GRAD-25_opsz48
 Missing or inaccessible sterility certificates, CoAs, or batch documentation can stall audits and production.

Textile processing redundancy

laundry_1000dp_73E0C1_FILL0_wght400_GRAD-25_opsz48
 When garments depend on a single processing facility, equipment failures or capacity constraints can disrupt availability. 

Emergency response gaps

running_with_errors_1000dp_73E0C1_FILL0_wght400_GRAD-25_opsz48
 Without predefined contingency plans, teams lose valuable time during supply disruptions or operational incidents.
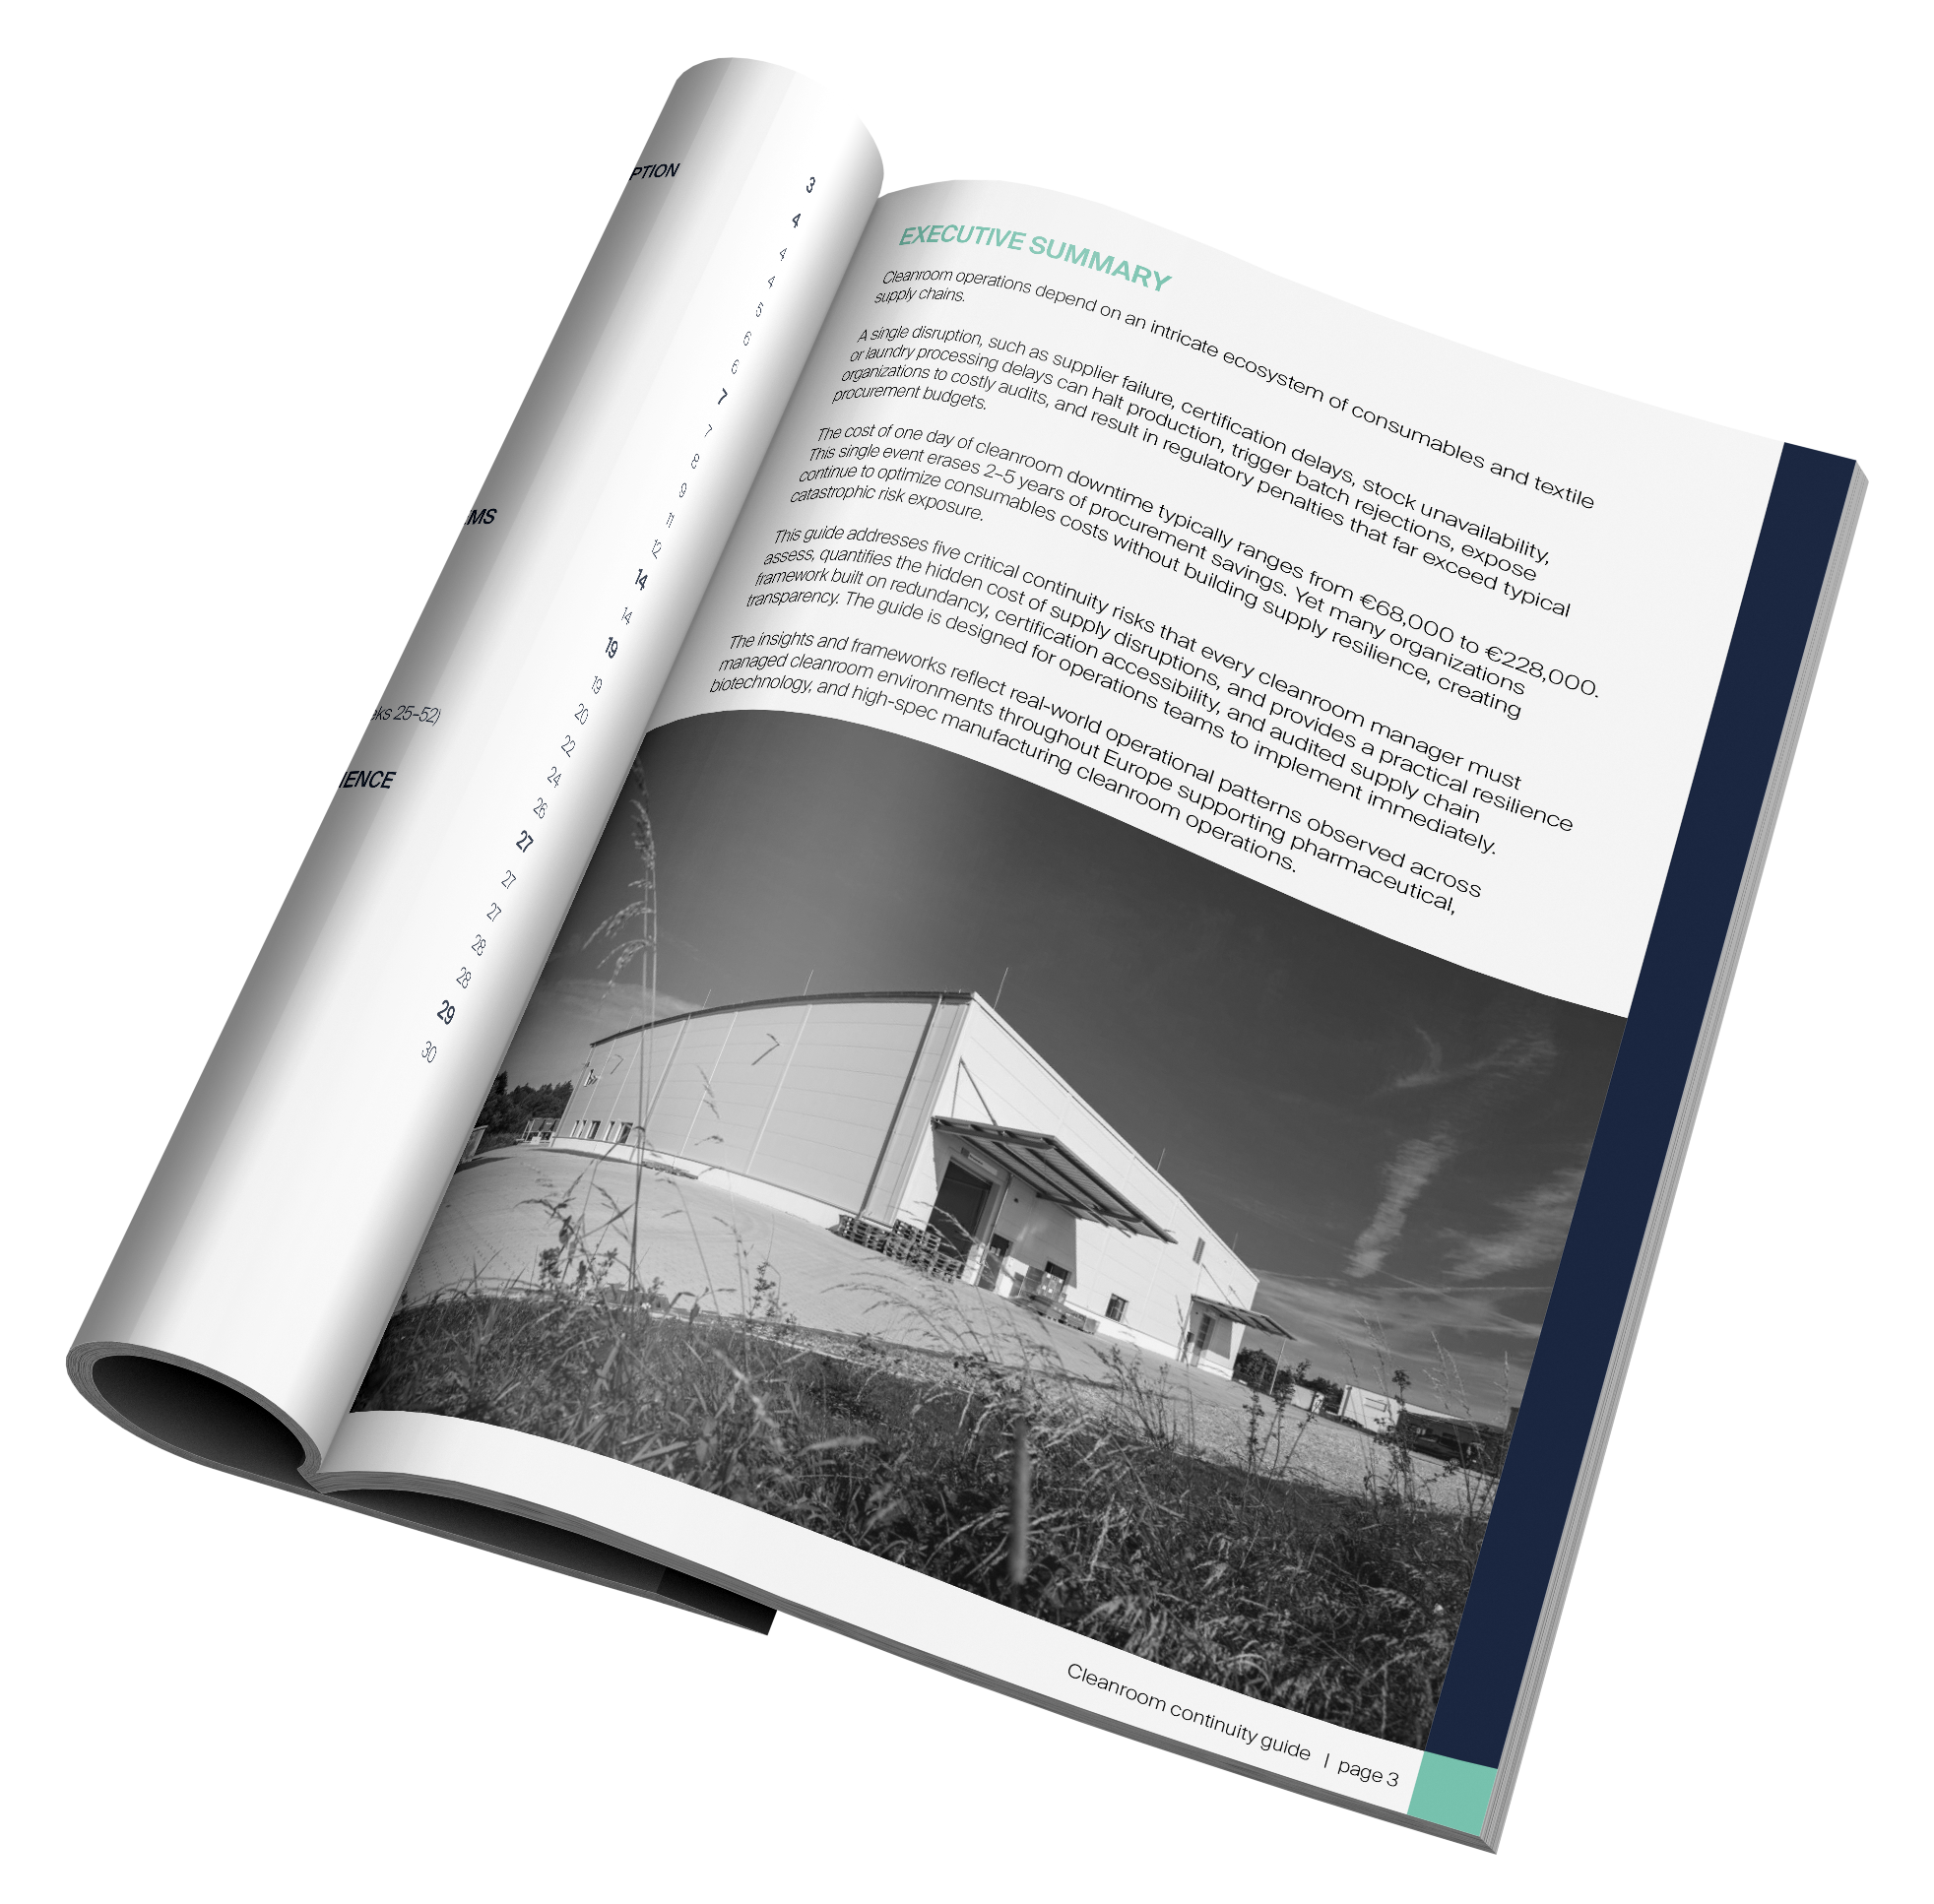
MAGAZINE PSD MOCKUP

Understand the Five Hidden Risks Behind Cleanroom Downtime

 Cleanroom disruptions rarely come from one big failure - they’re the result of unnoticed weaknesses across suppliers, inventory, and processes.

This guide helps you uncover those risks, measure their impact, and build a system that prevents them. 

What you'll get:

•  A clear view of downtime costs and operational impact 

•  A breakdown of the five risks most teams underestimate 

•  A practical way to evaluate your current resilience 

 •  A framework to strengthen supply and operations  

 •  A 12-month roadmap to implement improvements

 •  Checklists and tools you can use immediately

STEP 2

Reveal Your Cleanroom’s Vulnerabilities to See Where You’re Exposed

Most teams don’t have a clear view of their operational risk until downtime happens.

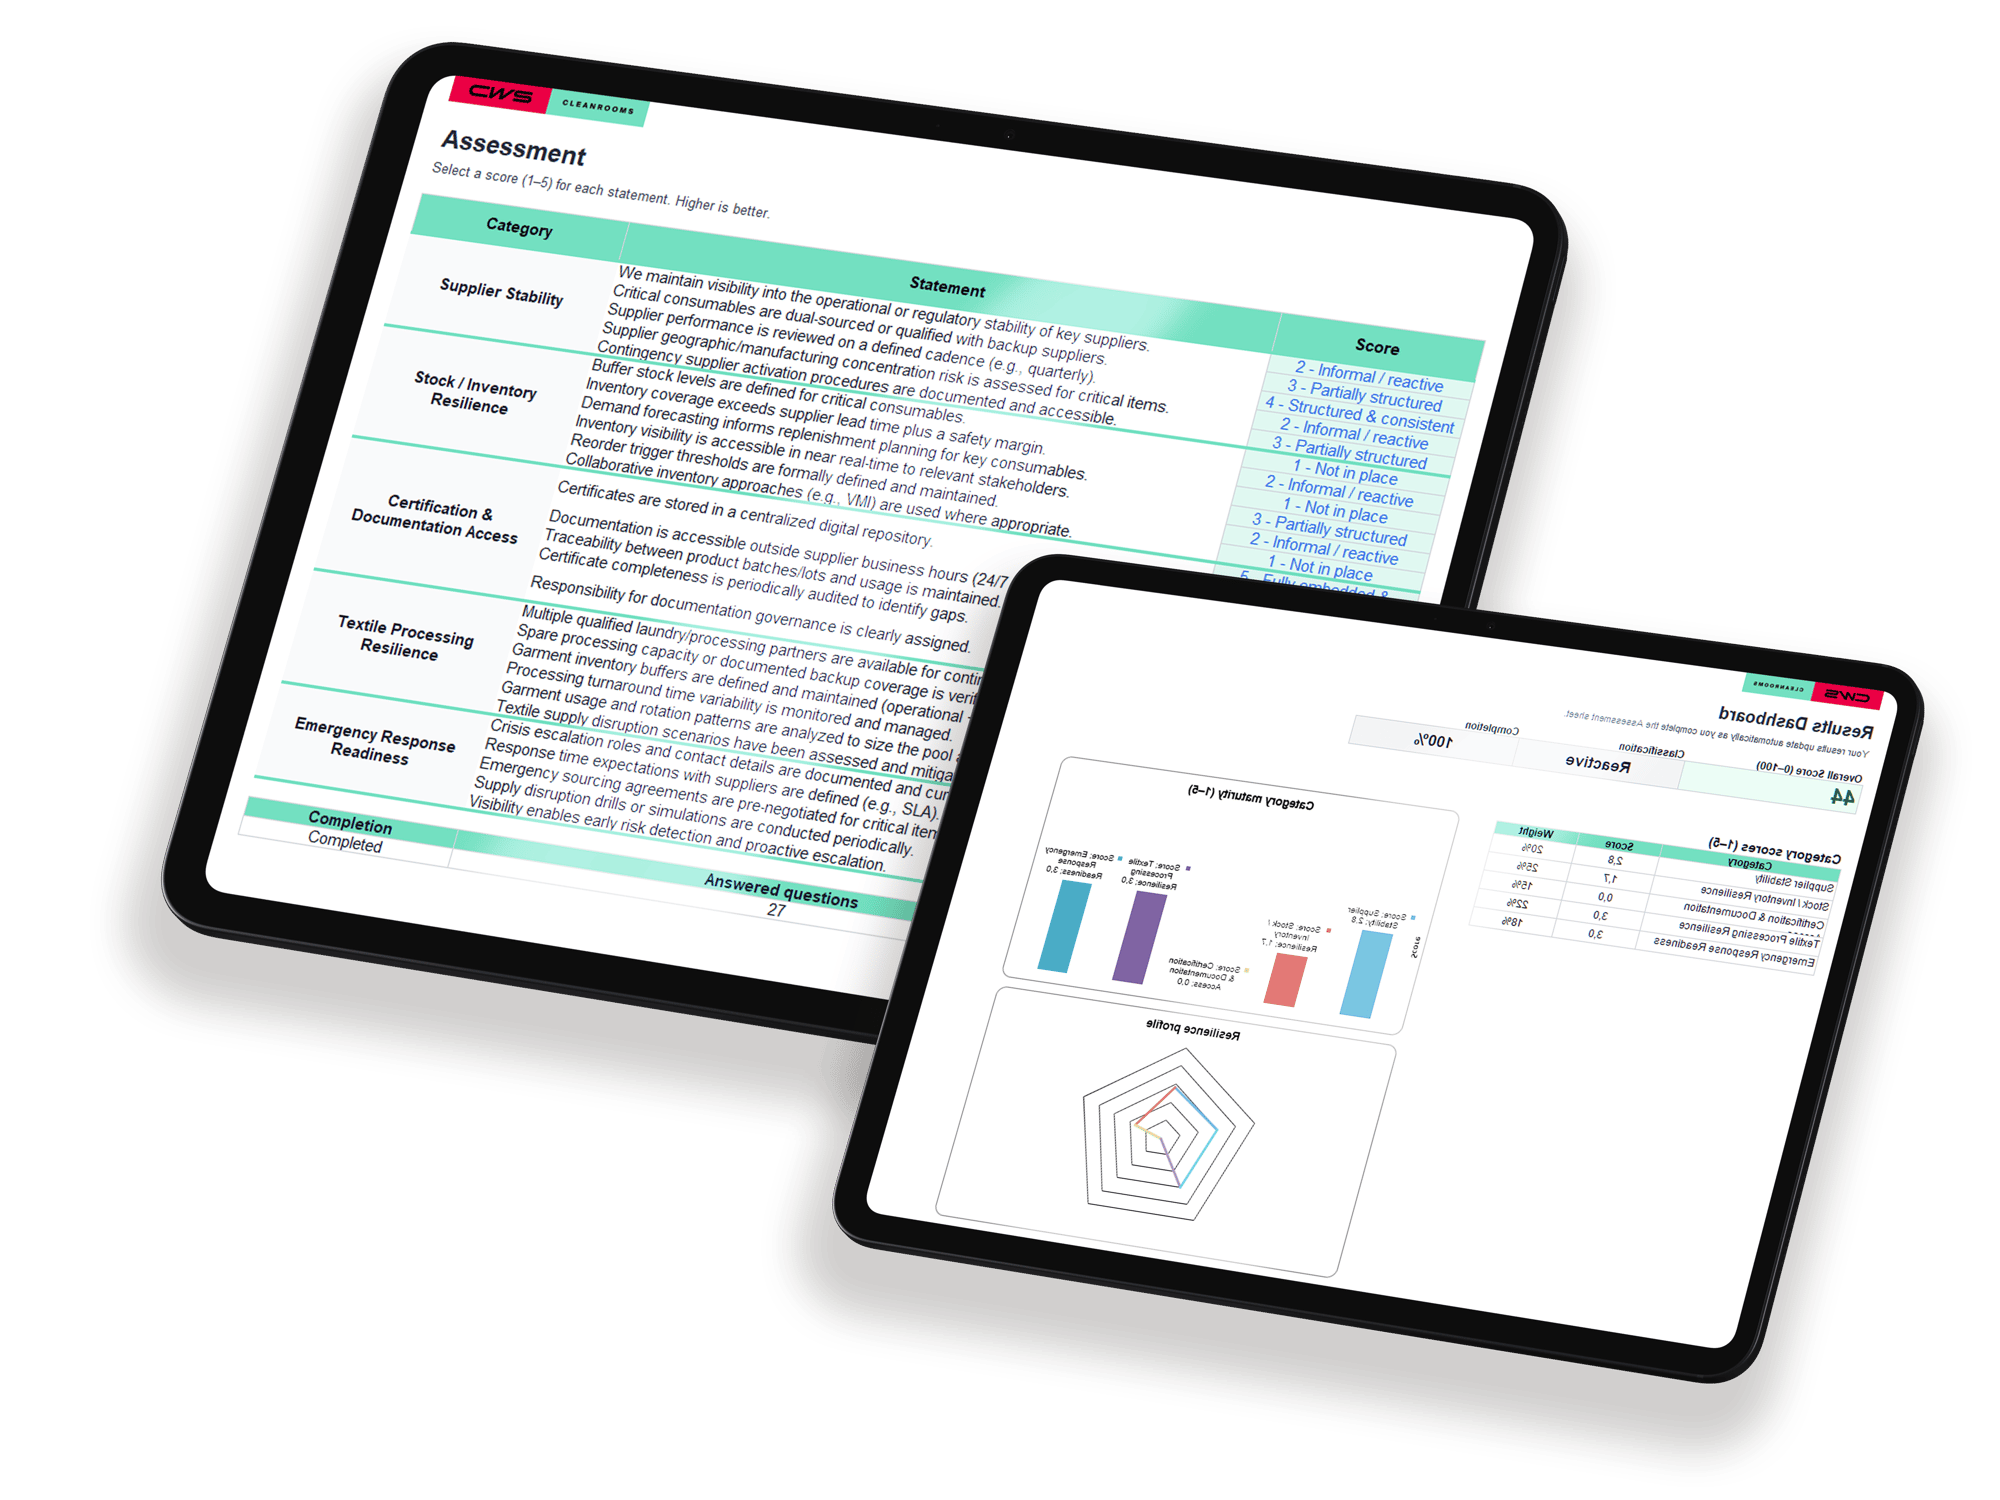
 The Continuity Self-Assessment helps you uncover those gaps and understand exactly where your operation is exposed. 

You'll be able to:

•  Score your operation across the five key continuity risks

•  See where your setup is strong and where it’s vulnerable

•  Turn qualitative practices into a clear, comparable risk level 

 •  Visualize results in a simple dashboard   

 •  Understand what to fix first

Self assessment mockup - flipped
Calculator mockup v2.2

Quantify the Financial Impact of Downtime

Short-term savings from low-cost suppliers often look good, until downtime, delays, and compliance risks are factored in.

The Downtime Cost Calculator helps you quantify the real financial impact of disruption and turn operational risk into a clear business case.

 With just a few inputs, you can: 

•  Calculate the true cost of downtime per incident 

•  Compare low-cost vs. resilient supplier scenarios 

•  See how quickly savings are outweighed by disruption costs  

•  Factor in labor inefficiencies and idle time 

 •  Estimate compliance and quality-related costs

 •  Identify your break-even point (when savings turn into losses)

STEP 3

Get Your Free Expert Cleanroom Continuity Risk Assessment

In a concise session with our Xperts, we’ll review your operation across the five continuity pillars and help identify where disruption risks may exist.

During the assessment, we will:

•  Evaluate your continuity exposure across supplier governance, inventory resilience, certification access, textile processing, and emergency readiness

•  Identify hidden operational vulnerabilities that could lead to supply disruption or downtime

•  Highlight practical improvement areas to strengthen resilience and reduce operational risk

•  Provide an expert perspective on how your current setup compares to best practices

Expert assessment image

CWS CLEANROOMS

STAXS®